RF, Digital Radio and
Metamaterial Fundamentals
Project
Digital Radio Undersampling, Upsampling, Downsampling, and Digital Downconversion
Overview
Work in assigned project groups.
The objective of this project is to simulate QAM digital radio and observe the IQ constellation diagram.
NOTE: Use the Project Report Template and keep answers to questions on consecutive sheets
of paper with all plots at the end.
IN NO CASE may code or files be exchanged between students, and
each student must answer the questions themselves and do their own
plots, NO COPYING of any sort! Nevertheless, students are
encouraged to collaborate in the lab session.
Part 1: Undersampling, Upsampling, Downsampling, and Digital Downonversion Simulation
- In this part, we investigate Digital Radio Undersampling, Upsampling, Downsampling, and Digital Downconversion.
- For details on radio design concepts, see:
- Load and run the Mattlab digital radio Simuulink file as follows:
- Download tfile twDigRadioUpDown2c.slx.zip
and unzip it
to your preferred Maatlab directory/folder
- Run Maatlab program, and click the MenuBar::Simuulink button to run
- Open the "twDigRadioUpDown2c.slx" design, and the following
schematic should appear.
- The upper-left dashed-blue box below encloses a simple upsampler
- The upper-right dashed-cyan box below encloses a simple downsampler
- The center-right dashed-magenta box below encloses a simple DDC (digital down converter)
- The bottom-right solid-red box below encloses a simple undersampling downconverter
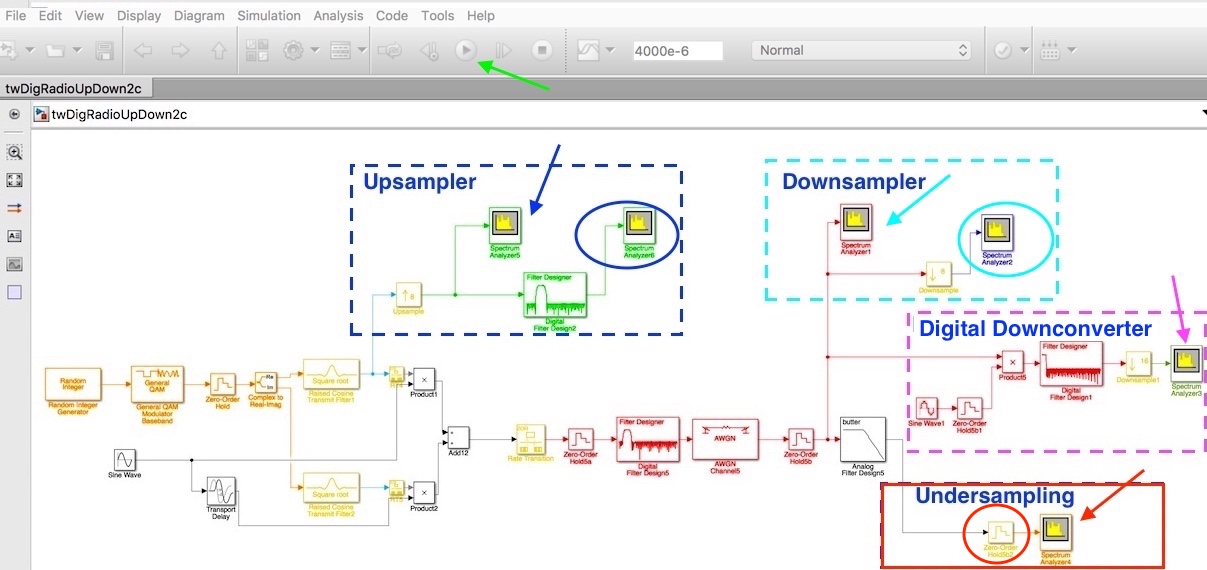
Fig 001
- Save a snapshot of the schematic for your
report.
- Downsampling
- Double-click the run button (green arrow above) to simulate.
- Double-click spectrum analyzer 1 (cyan arrow above) to observe the
QAM spectrum similar to below (your spectrum should have a different
carrier frequency and bandwidth)
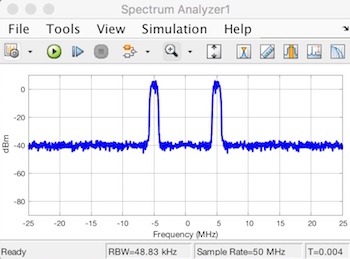
Fig 002
- Save a snapshot for your
report.
- The output of the downsampler is given by spectrum analyzer 2 (cyan circle in the schematic above)
- Double-click the run button (green arrow in the schematic above) to simulate.
- Double-click spectrum analyzer 2 (cyan circle in the schematic above) to observe the downsampled QAM spectrum similar to below (your spectrum should have a different carrier frequency and bandwidth)
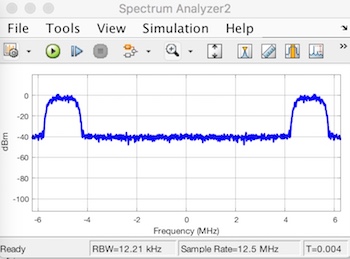
Fig 003
- Make sure that the full frequency range is plotted and y-axis goes from +10 to -90 dB
- Save a snapshot for your
report.
- Did the frequency of the carrier change after downsampling?
- Did the bandwidth of the signal change after downsampling?
- What changed?
- Digital downconverter (DDC)
- Double-click the run button (green arrow above) to simulate.
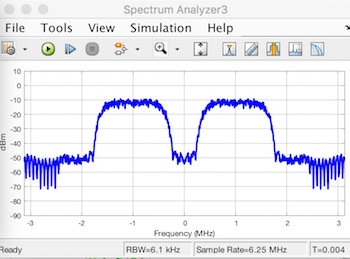
- Double-click spectrum analyzer 3 (magenta arrow in the schematic above) to observe the digital downconverter QAM spectrum similar to below (your spectrum should have a different carrier frequency and bandwidth)
Fig 004
- Make sure that the full frequency range is plotted and y-axis goes from +10 to -90 dB
- Save a snapshot for your
report.
- Did the frequency of the QAM carrier change after digital donconversion?
- Did the bandwidth of the signal change after digital donconversion?
- What was the frequency of the digital local oscillator?
- Note the downsampler in the DDC output to reduce data rate!
- Undersampling downconverter
- Double-click the run button (green arrow above) to simulate.
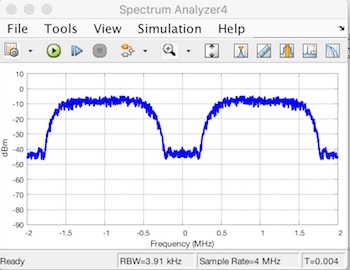
- The output of the is given by spectrum analyzer 4 ( red arrow in the schematic above)
- Double-click spectrum analyzer (red arrow in the schematic above) to observe the undersampling downconverter QAM spectrum similar to below (your spectrum should have a different carrier frequency and bandwidth)
Fig 005
- Make sure that the full frequency range is plotted and y-axis goes from +10 to -90 dB
- Save a snapshot for your
report.
- What was the undersampler sampling frequency set by the zero-order hold (red circle in the schematic above)
- Did the frequency of the QAM carrier change after undersampling?
- Did the bandwidth of the signal change?
- Upsampler
- Double-click the run button (green arrow above) to simulate.
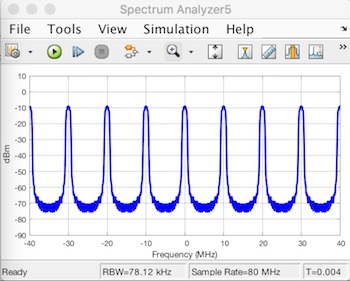
- The upsampler makes use of the baseband signal, and converts it to a higher frequency
- The upsampler places "zeroes" between the original samples, and increases the clock rate proportionally
- However, the upsampler generates many harmonic aliases of the original spectrum
- The baseband signal is given by spectrum analyzer 5 (blue arrow in the schematic above)
- Double-click spectrum analyzer 5 (blue arrow in the schematic above) to observe the baseband QAM spectrum similar to below (your spectrum should have a different carrier frequency and bandwidth)
Fig 006
- Make sure that the full frequency range is plotted and y-axis goes from +10 to -90 dB
- Save a snapshot for your
report.
- Next, a digital filter is used to remove all but one of the many harmonic aliases
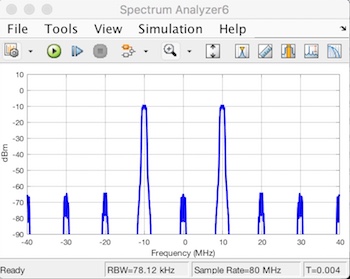
- The filtered upsampler output is given by spectrum analyzer 6 (blue circle in the schematic above)
- Double-click spectrum analyzer 6 (blue circle in the schematic above) to observe the filtered upsampler output QAM spectrum similar to below (your spectrum should have a different carrier frequency and bandwidth)
Fig 007
- Make sure that the full frequency range is plotted and y-axis goes from +10 to -90 dB
- Save a snapshot for your
report.
- Did the upsampler shift the baseband signal to a carrier frequency?
- What clock determines the carrier frequency?
- See report template below
Report Data
- ============================
WARNING !! ====================================
- **** WARNING **** YOU MUST USE
THE PROJECT REPORT TEMPLATE Below:
- See the Project
Report Template at bottom of this page
- A well-written report/paper is
EXPECTED
- STRONGLY RECOMMEND that you read IEEE
authorship series: How to Write for Technical Periodicals
& Conferences
- Clearly describe everything, including:
- variables in block diagrams
- variables in formulas
- units of variables kHz, pF, nH, m, s,
- all traces on plots
- all curves on plots
- all results in any tables
- Minimum required data content for
your report and demos
- Required theory/formulas numbered as below:
- (1) formula for downsampling output y[n], given input x[n]
- (2) formula for upsampling output y[n], given input x[n]
- Required figures:
- Any illegible plots receive zero credit (must be able to read all numbers, axes, labels, curves, grids, titles, legends)
- All plots must of professional quality as in IEEE papers
- LEGIBLE block diagram of the experiment as in Fig 001 above (will be somewhat illegible because it it so large)
- LEGIBLE simulation spectrum of QAM signal as in Fig 002 above, with appropriate caption
- LEGIBLE simulation spectrum of downsampled QAM signal as in Fig 003 above
- LEGIBLE simulation spectrum of DDC downconverted QAM signal as in Fig 004 above
- LEGIBLE simulation spectrum of undersampling downconverted QAM signal as in Fig 005 above
- LEGIBLE simulation spectrum of the filtered upsampled QAM signal as in Fig 007 above
- Required tabular data content:
- Table with 2 columns: parameter, then value of the parameter,
- Row 1: QAM signal carrier frequency of spectrum analyzer1 in MHz
- Row 2: QAM signal bandwidth of spectrum analyzer1 in MHz (bandwidth at points 20 dB down from peak of passband)
- Row 3: QAM signal carrier frequency of spectrum analyzer2 (downsampler output) in MHz
- Row 4: QAM signal carrier frequency of spectrum analyzer3 (DDC output) in MHz
- Row 5: QAM signal carrier frequency of spectrum analyzer4 (undersampler output) in MHz
- Row 6: QAM signal carrier frequency of spectrum analyzer6 (upsampler output) in MHz
- Row 8: sample rate of the DDC output at analyzer2
- Row 9: sample rate of the undersampler output at analyzer4
- Row 10: sample rate of the upsampler at analyzer2
See report template below
NOTE ReportTemplate: Use the Project Report Template
YOU MUST ADD CAPTIONS AND FIGURE
NUMBERS TO ALL FIGURES!!
Copyright © 2010-2018 T. Weldon
ANSYS, and HFSS are registered trademarks of ANSYS, Inc.
Cadence, Spectre and Virtuoso are registered trademarks of
Cadence Design Systems, Inc., 2655 Seely Avenue, San Jose, CA
95134. Keysight is a registered trademarks of Keysight
Technologies, Inc. MATLAB and Simulink are registered
trademarks of The MathWorks, Inc. MATHCAD is a trademark of PTC INC.