UNC Charlotte Agilent ADS Tutorial (Project 2)

Agilent ADS and Cadence 6 Software Tutorials, continued


Overview

Remain in same project groups for the semester. 

The objective of this project is to simulate pulse reflection and continue intro to ADS and Cadence.

NOTE: Use the Project Report Template and  keep answers to questions on consecutive sheets of paper with all plots at the end.

IN NO CASE may code or files be exchanged between students, and each student must answer the questions themselves and do their own plots, NO COPYING of any sort! Nevertheless, students are encouraged to collaborate in the lab session.

Only turn in requested plots ( Pxx ) and requested answers to questions ( Qxx ).


Part 1

  • Start the software:
  • From a Linux terminal, ADS should be available in the  menu (Mosaic->Engineering->Electrical->Agilent->ADS)
  • From a PC terminal, you must first open a remote Linux session,  then proceed as for a Linux terminal
  • Download the following zip-file (you may need to hold down the shift key while you click on the link):
    RFcourse2012_pulse1a_wrk.zip

  • Move the zip-file into the apps/ads directory, and extract it
  • You should find a new directory RFcourse2012_pulse1a_wrk created in apps/ads

  • Run ADS and open the new workbook by double-clicking it

  • Go down through the directory tree to pulse1/schematic and double click that design file. Double-click the schematic in the right half of the window, and the following schematic should appear.  (1 mil = 1/1000 inch)

  • Save a snapshot of the schematic and paste it into your report.  ( P1 )

  • Double-click the transmission line and look at the variables in the pop-up menu.  Select the variables and observe the changing description at the bottom of the pop-up.

  • Double-click the "gear" icon (shown below) in the upper right of the window to simulate.

    z

  • The data plotting window should appear.
  • Click the "rectangular plot" icon (shown below) in the left of the window to simulate.

    z

  • Drop the plotting box in the visible area, and in the pop-up window:

    Select DataSet -> V1 -> Add
    Select DataSet -> V2 -> Add
    Select DataSet -> Vsrc -> Add

  • Drop a second plotting box in the visible area, and in the pop-up window:

    Select DataSet -> V1 -> Add
    The screen should appear as:

  • Click OK, and the following Time-domain plot should appear.

  • Save a snapshot of the time-domain plot as illustrated below and turn it in.  (snap a region only, so the plot is legible -- dont print the window pane). You may wish to use MenuBar::Marker::New to add markers to measure voltages. ( P2 )

  • Compute the impedance of the line using the formula in the textbook. ( Q1 )
  • Use linecalc tool to compute the impedance and electrical length of the line at 1GHz as illustrated below.  Note that the MSUP element in the schematic specifies the thickness and dielectric constant of the substrate.
  • Copy the linecalc window and paste it into your report template. Make sure that it is legible in your report! YOU MUST ADD CAPTIONS AND FIGURE NUMBERS TO ALL FIGURES!!  ( P3 )
  • For snapshots use the Linux menu Graphice::Ksnapshot and select the option to take a legible snapshot of a window rather than full screen
  • Compute Gamma 1 from the component values on the schematic (reflection coefficient at 1st reflection, at interface between source and transmission line) ( Q2 )

    Does the simulated voltage agree with your computed reflection coefficient?

  • Compute Gamma 2 from the component values on the schematic (reflection coefficient at the reflection at far end of line, at the load) ( Q3 )

  • Compute Gamma 3 from the component values on the schematic (reflection coefficient at input, after "round-trip" return) ( Q4 )

  • Change the source impedance R1 to 50 ohms, and resimulate the circuit.

  • Save a snapshot of the time-domain plot as illustrated for P2 and turn it in.  (snap a region only, so the plot is legible -- dont print the window pane). ( P4 )

  • Compute Gamma 1 from the component values on the schematic (reflection coefficient at 1st reflection, at interface between source and transmission line) ( Q5 )

    Does the simulated voltage agree with your computed reflection coefficient?

  • Compute Gamma 2 from the component values on the schematic (reflection coefficient at the reflection at far end of line, at the load) ( Q6)

  • Compute Gamma 3 from the component values on the schematic (reflection coefficient at input, after "round-trip" return) ( Q7 )


  • Part 2

  • Download this Example RFIC cadence layout ami05_RF_PayamShoghiCadence31may07b.zip as described in this paper
  • Move the file to your NCSU directory where "junk1" is and extract the tarfile
  • Close Cadence
  • Fix the links in ~/cadence6/NCSU16/cds.lib by opening cds.lib (use the nedit/gedit editor in linux)and editing it to add this line:
  • DEFINE ami05_RF_PayamShoghiCadence31may07  ami05_RF_PayamShoghiCadence31may07
  • Re-open/run Cadence
  • The new library should appear as below

  • plibs


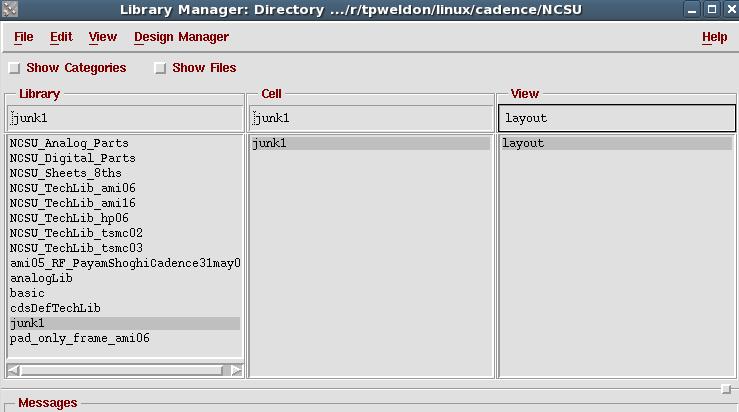
  • In ami05_RF_PayamShoghiCadence31may07, open the layout_1G layout as below

  • rfic


  • Save a snapshot of this layout as above, and put it in your report ( P5 )
  • Also check the mosis.com website to learn more about the fabrication service.

  • Run a DRC error check using MenuBar::Verify::DRC and observe the error information in the icfb window that appeared when you first ran Cadence.

  • err


  • Dont worry about any errors (there may be even more than above), just print whatever errors you have as shown above ( P6 )
  • More tutorials are at a variety of other websites.see also
  • http://www.eda.ncsu.edu/wiki/NCSU_EDA_Wiki
  • http://www.cadence.com/support/university/ww_usp.aspx
  • http://www.ece.umd.edu/~dilli/research/layout/cadencetutorial/cadencedemo9.html
  • http://www.coe.uncc.edu/~tpweldon/courses/mixsig/cadence.html


  • rfic


  • Save a snapshot of this layout as above, and put it in your report ( P7 )
  • Part 3

  • Look at the ADS Help on-line manuals (see the help tab in ADS), then answer the following questions and turn them in. It is usually best to use help index accessable from an ADS window to search the manuals.

  • What is the difference between an ADS Project and an ADS Design? ( Q8 )

  • Can an S-parameter simulation controller be used to simulate group delay (Yes/No)? ( Q9 )

  • Harmonic Balance Simulation Controller cannot be used to simulate multitone simulation of circuits that exhibit intermodulation (True / False). ( Q10 )

  • ADS can create stacked plots when viewing simulation results (True / False). ( Q11 )

  • ADS can BOTH read and write (import and export) GDSII files (True / False). ( Q12 )

  • ADS can BOTH read and write (import and export) SPICE files (True / False). ( Q13 )

  • What is a PLC component in ADS?
    Hint: see Lumped Circuit Components section. ( Q14 )

  • What is a TERM component used for in S-parameter simulation in ADS? Hint: port imped. ( Q15 )

  • What does the parameter Shmod control in the BSIM3SOI_MODEL for SOI MOSFET's in ADS?
    Hint: see Nonlinear Devices Components section. ( Q16 )


  • Report
    NOTE: Use the Project Report Template and  keep answers to questions on consecutive sheets of paper with all plots at the end.

    Do not add extraneous pages or put explanations on separate pages unless specifically directed to do so. The instructor will not read extraneous pages!

    Only turn in requested plots ( Pxx ) and requested answers to questions ( Qxx ). All plots must be labeled P1, P2, etc. and all questions must be numbered Q1, Q2, etc.  YOU MUST ADD CAPTIONS AND FIGURE NUMBERS TO ALL FIGURES!! 


    Copyright © 2010 T. Weldon