Microwave Circuits and
Metamaterials
Project 11
Overview
Remain in same project groups for the
semester.
The objective of this project is to measure the resonance of a split
ring resonator .
NOTE: Use the Project Report Template and keep answers to questions on consecutive sheets
of paper with all plots at the end.
IN NO CASE may code or files be exchanged between students, and
each student must answer the questions themselves and do their own
plots, NO COPYING of any sort! Nevertheless, students are
encouraged to collaborate in the lab session.
Only turn in requested plots ( Pxx )
and requested answers to questions ( Qxx ).
Part 1
- In this part, a split ring resonator is measured in the lab.
- S-parameter measurements of a split ring:
- We will be making S-parameter measurements that roughly
correspond to a situation similar to our project 10
simulation.
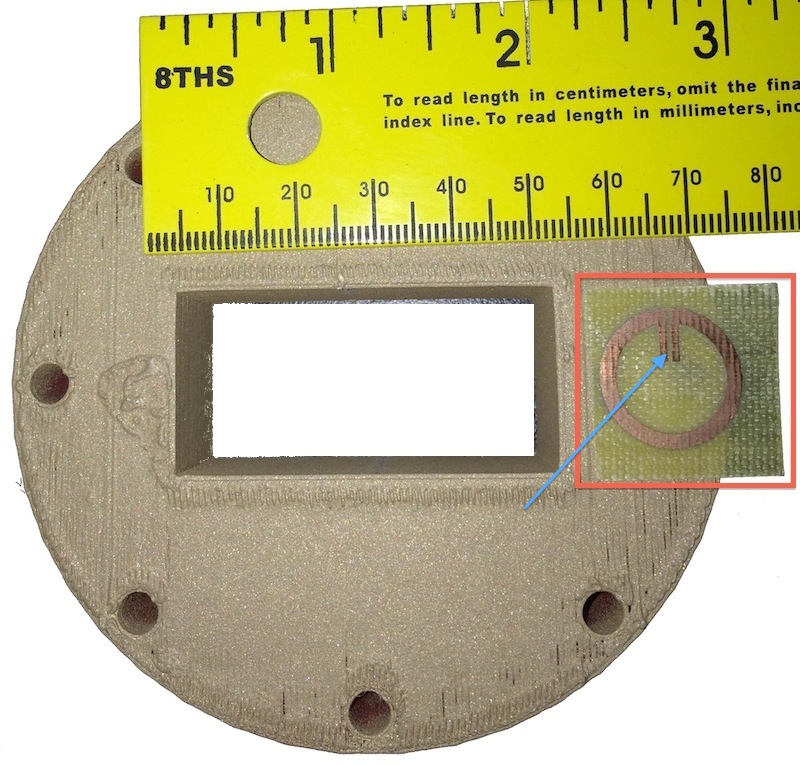
- The split-ring resonator (red square below) is fabricated on
an FR4 printed circuit board
- The gap in the split ring (blue arrow above) is elongated to
increase capacitance and tune to the desired resonant
frequency
- The WR187 waveguide above has an inner dimension of 4.75x2.2
cm, a 3.153 GHz cutoff, and a 3.95 - 5.85 GHz operating
band
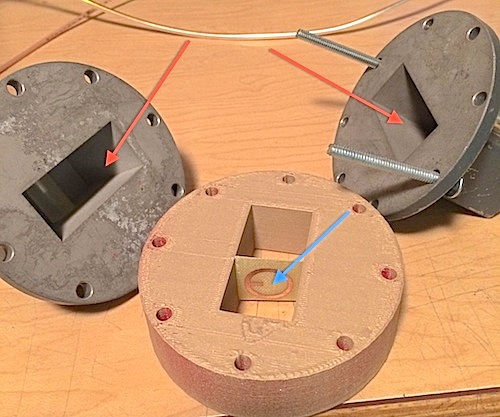
- The split ring (blue arrow below) is inserted into the
waveguide for testing as follows
- After the split ring is inserted, the waveguide section
containing the split ring is bolted to the two waveguide
adapters (red arrows above)
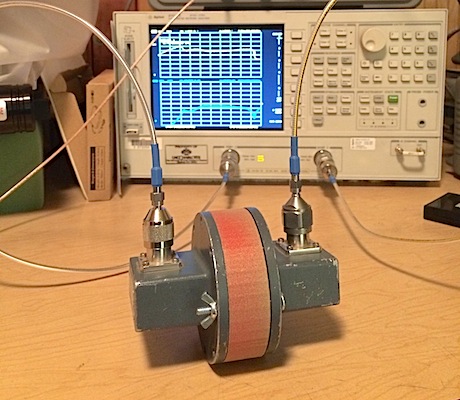
- The final assembly ready for testing is shown below
- Connect the waveguide flange outputs to ports 1 and 2 of the
Agilent 8753ES vector network analyzer as shown above
- Have the instructor adjust the display to the following
format:
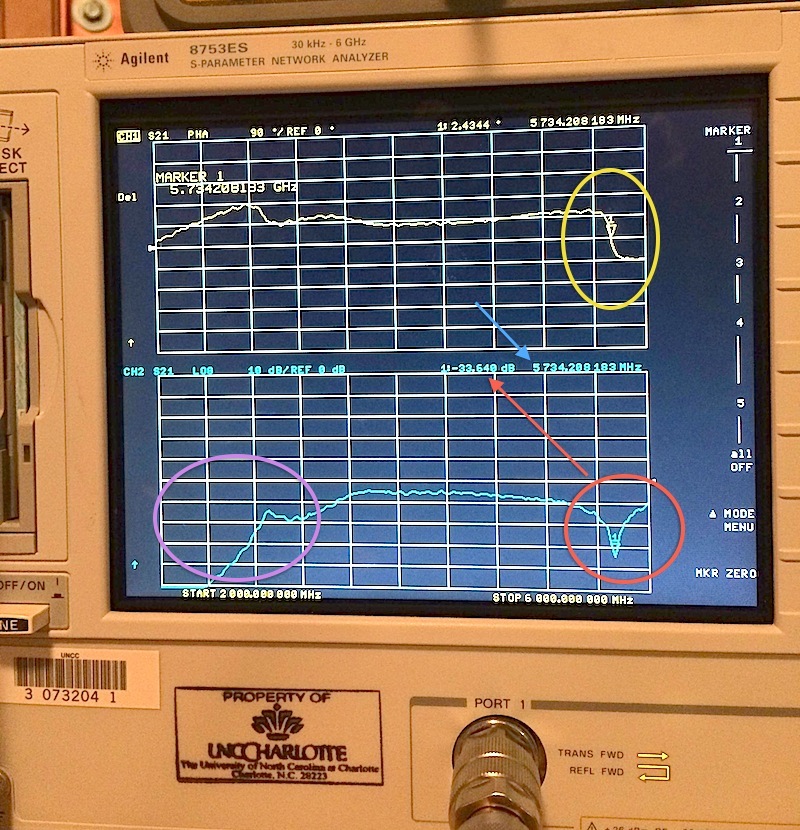
- Check that the start/stop are 2 GHz and 6 GHz (bottom
of screen above), and that the two plots are S11 phase (top
plot) and S11 magnitude (bottom plot)
- Observe the great attenuation below the cutoff of the
waveguide (purple circle above)
- Set the marker in the middle of the resonance in S21 (red
circle above)
- Observe the resonance of the split ring (red circle above)
with 33 dB attenuation (red arrow above) at 5.7 GHz
(blue arrow above)
- Observe the abrupt 180 degree phase shift at resonance
(yellow circle above)
NOTE ReportTemplate: Use the Project Report Template
and keep answers to questions on
consecutive sheets of paper with all plots at the end.
Do not add extraneous pages or put explanations on separate
pages unless specifically directed to do so. The instructor will
not read extraneous pages!
Only turn in requested plots (Pxx )
and requested answers to questions (Qxx ).
All plots must be labeled P1, P2, etc. and all questions must be
numbered Q1, Q2, etc. YOU MUST ADD CAPTIONS AND FIGURE
NUMBERS TO ALL FIGURES!!
Copyright 2010-2015 T. Weldon
Cadence, Spectre and Virtuoso are registered trademarks of
Cadence Design Systems, Inc., 2655 Seely Avenue, San Jose, CA
95134. Agilent and ADS are registered trademarks of Agilent
Technologies, Inc.