ECGR4124 Project 6, Circular Convolution and FFT
Form the same groups of 3 as before. Members of any group must
be
all graduate or all undergrad.
Do NOT use "zoom" feature on
any
plots unless specifically requested.
Preliminary tasks
- Run NetBeans
5.5, or a later version
(Start>AllPrograms>MosaicXp>Programming>Netbeans>NetBeans55)
- Make a copy of your previous project from within NetBeans, and
name
this new project p4DSPsoundv55a. To do this, right-click
the
project in the ProjectPane, and select CopyProject.
- Close the old project (right-clicl>CloseProject)
- Clean and build the new project
(NetBeans>Build>CleanAndBuildMainProject)
- Hopefully there will be no errors. Use this new copy to
build project 4.
- To greatly speed up
execution, you may comment out the following three
lines in
method refreshdisplay() of DSPsoundv55aUI.java.
However,
this trick will disable the writing of the data files f1.txt,
f2.txt,
and disp.txt. It seems that the MOSAIC afs file-system is
very
slow when these files are written, for some reason.
//
inData1.writeraw("f1.txt");
//
inData2.writeraw("f2.txt");
//
dispData.writeraw("disp.txt");
- Write your explanations on a seperate answer sheet as
described
in the report requirements below, 2 or 3 sentences should
suffice for
most explanations.
- Use "Write PNG" button on the interface to save the plots as
".png" graphics files to be included in your reports. Do NOT
chop off
portions of the
printout. Do not
use
"print screen" or copy/paste, since this will cause you to lose
resolution on the printouts.
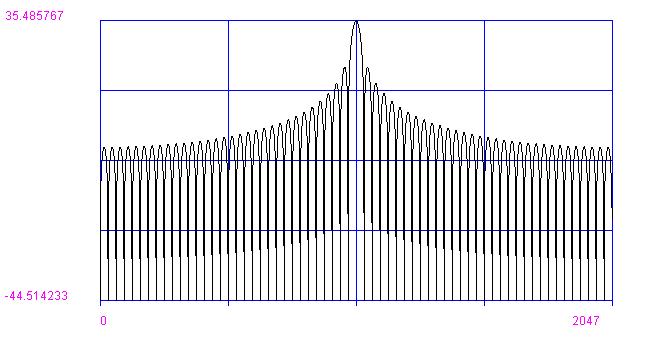
- Make
sure
that your 20log10|FFT| from project 2 is working correctly,
with DC
(zero-frequncy) in the center of the plot. To test this,
you
should get the following results for box64.au. If you do
not get
the following result, see the instructor or TA.
- What system did J. Presper Eckert Jr. invent and complete in
late
1945? ( Q4 )
Report
Use the Project
Report Template
(also shown as pdf file)
Include the plot numbers P1, P2, etc
in
captions, along with a short description!
Write a cover sheet + 1 page executive
summary ONLY!!! Describe any unresolved issues.
Place answers to all questions on one or more consequitive sheets
of paper at the front of the report!
Do NOT scatter
the question answer sheets throughout the report, keep them
together
Do NOT use "zoom" feature on
any
plots unless specifically requested.
Make sure that you include question
numbers and plot numbers on all sheets!
I will only look on the question answer-sheets for any discussion.
All extraneous material WILL BE
IGNORED!
Do not write any discussion, except directly on the question
answer-sheets or 1 page summary.
Do not add extraneous pages.
Do not put explanations on plots unless
specifically directed to do so.
Include any problems or unresolved issues in the summary.
Copyright 2009 T.P. Weldon