Electromagnetic Waves
Project
Backward Waves
Overview
Work in assigned project groups.
The objective of this project is to simulate backward waves.
NOTE: Use the Project Report Template
IN NO CASE may code or files be exchanged between students, and
each student must answer the questions themselves and do their own
plots, NO COPYING of any sort! Nevertheless, students are
encouraged to collaborate in the lab session.
Part 1: Simulation
- Simulation of a backward wave
- You are to simulate a backward wave in maatlab as illustrated below
- Recall that a backward wave group velocity is in the opposite direction as phase velocity
- You should observe a movie where
- The peak (or valley) of the high frequency sinusoid (blue arrow below) moves to the right
- The peak of the low-frequency envelope (red arrow and red outline below) moves to the left
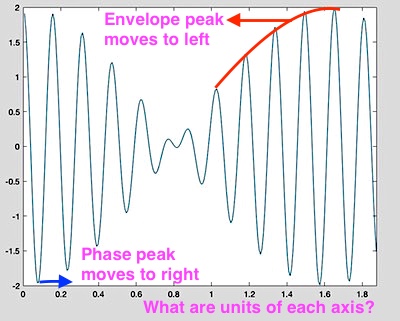
Fig 001
- To creat the simulation in maatlab simulator, enter the following code as a ".m" script file in the maatlab editor window
% backward wave
clear all
close all
w1=2*pi*10^9 %frequency 1 in rad/s
w2=1.05*w1 %frequency 2 in rad/s
c=3*10^8 %speed of light in m/s
vp1=c/2 %phase velocity at w1 in m/s
b1=w1/vp1 %propagation constant at w1
lam1=2*pi/b1 %wavelength lambda1 in m
vp2=1.1*c/2/0.95 %phase velocity at w2
b2=w2/vp2 %propagation constant at w2
vg=(w2-w1)/(b2-b1) %group velocity = d omega / d beta
lam2=2*pi/b2 %wavelength lambda2
numx=250 %num of spatial points in plot
numt=200 %num of spatial points in plot
dx=lam1/5/4 %spatial separation of points in plot
dt=0.1/10^9 %time separation of movie frames in plot movie
for nt=1:numt;
for nx=1:numx;
t=nt*dt; x=nx*dx; xx(nx)=x;
y(nx)=real( exp(i*(w1*t-b1*x)) + exp(i*(w2*t-b2*x)) );
end;
plot(xx,y);axis([0 dx*numx -2 2]);
pause(0.1)
mov(nt) = getframe;
end;
h2=figure(2);
movie(mov);
v = VideoWriter('backwave','MPEG-4');
open(v);
writeVideo(v,mov);
close(v);
- Run the code, and observe the movie output
- You can also play the movie file saved in the directory (the movie may allow better speed adjustment)
- Save a picture like Fig. 001 above for your report
- How many frequencies are in the signal? What are those frequencies?
- Why is the signal 2 volts peak?
- What is the phase velocity of each frequency?
- What is the phasor magnitude for each frequency?
- What is the group velocity of the total signal?
- What are the units of the two axes?
- How big are the timesteps between each movie frame (not the "pause" time, but the simulation timestep "dt")
- How long in meters is the wavelength lambda for frequency w1?
Save your files and plots before exiting
Part 2: Simulation of forward ("normal") waves
-
Forward ("normal") waves
- Edit the code to create a forward "normal" wave
- To do this, leave vp1 unchanged, and change vp2 to be equal to vp1
- Then rerun the simulation
- Are the phase peaks and envelope now moving in the same direction?
- Take a new snapshot of the forward waveform for your report
- What is the phase velocity of each frequency?
- What is the phasor magnitude for each frequency?
- What is the group velocity of the total signal?
Save your files and plots before exiting
Report Data
- ============================
WARNING !! ====================================
- **** WARNING **** YOU MUST USE
THE PROJECT REPORT TEMPLATE Below:
- See the Project
Report Template at bottom of this page
- A well-written report/paper is
EXPECTED
- STRONGLY RECOMMEND that you read IEEE
authorship series: How to Write for Technical Periodicals
& Conferences
- Clearly describe everything, including:
- variables in block diagrams
- variables in formulas
- units of variables kHz, pF, nH, m, s,
- all traces on plots
- all curves on plots
- all results in any tables
- Minimum required data content for
your report and demos
- Required theory/formulas numbered as below:
- (1) Phase velocity formula
- (2) Group velocity formula
- Required figures numbered as below:
- Any illegible plots receive zero credit (must be able to read all numbers, axes, labels, curves, grids, titles, legends)
- All plots must of professional quality as in IEEE papers
- LEGIBLE plot of backward wave similar to Fig. 001 above but with axis units labeled, with appropriate caption.
- LEGIBLE plot of forward wave similar to Fig. 001 above but with axis units labeled, with appropriate caption.
- Required tabular data content:
- Table of backward-wave parameters with 3 columns: parameter name, value, units
- Row 1: frequency w1 in Hz
- Row 2: wavelength of frequency w1 in m
- Row 3: phase velocity of frequency w1 in m/s
- Row 4: frequency w2 in Hz
- Row 5: phase velocity of frequency w2 in m/s
- Row 6: group velocity in m/s
- Table of forward-wave parameters with 3 columns: parameter name, value, units
- Row 1: frequency w1 in Hz
- Row 2: phase velocity of frequency w1 in m/s
- Row 3: frequency w2 in Hz
- Row 4: phase velocity of frequency w2 in m/s
- Row 5: group velocity in m/s
- See report template below
NOTE ReportTemplate: Use the Project Report Template
YOU MUST ADD CAPTIONS AND FIGURE
NUMBERS TO ALL FIGURES!!
Copyright © 2010-2019 T. Weldon
ANSYS, and HFSS are registered trademarks of ANSYS, Inc.
Cadence, Spectre and Virtuoso are registered trademarks of
Cadence Design Systems, Inc., 2655 Seely Avenue, San Jose, CA
95134. Keysight is a registered trademarks of Keysight
Technologies, Inc. MATLAB and Simulink are registered
trademarks of The MathWorks, Inc. MATHCAD is a trademark of PTC INC.